What’s the cheapest energy source?
The answer is not as simple as you might think.
The most common argument is that wind and solar power are the cheapest clean energy sources and that nuclear power plants are the most expensive. Taken at face value, it is true that a single solar photovoltaic (PV) panel is cheap, and that a single wind turbine is cheap, while on the other hand, a single nuclear power plant costs billions of pounds. Technically, measured one-on-one, it is correct that wind and solar are cheaper. But is it useful to compare them in this way?
This over-simplistic method of comparison is, unfortunately, commonplace among journalists, clean energy advocates, and even politicians. But the reality is that one wind turbine or solar panel is not truly equivalent to one power plant in terms of energy generation. It is like comparing apples and oranges in that regard. So let’s get into the nitty-gritty and take a look at how different types of energy costs add up.
Examining the ‘Levelised Cost of Energy’ (LCOE)
To understand why people argue that wind and solar power are cheaper, we need to examine the basic economic metric for assessing a generating power plant: the Levelised Cost of Energy (LCOE). This metric provides what is essentially a banker’s number that covers the total amount of power over the lifetime of an energy source, divided by the lifecycle costs over the lifetime of the same energy source.
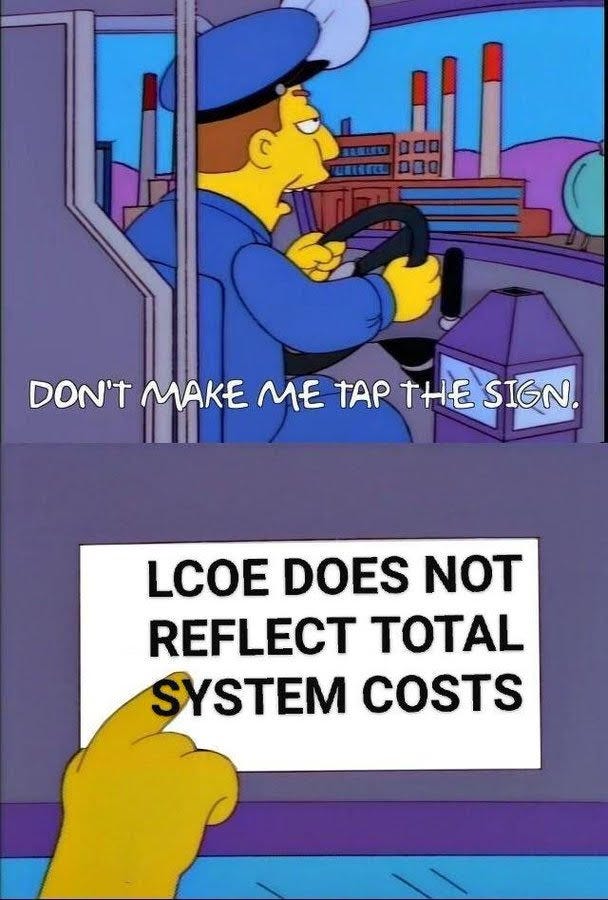
But there’s a problem: LCOE is a terrible metric for assessing cost-effectiveness because it doesn’t include several crucial factors. For example, it ignores costs and benefits at an energy system level, such as price reductions due to low-carbon generation and higher system costs when extra interconnection, storage, or backup power is needed due to the variable output of wind and solar power.
Crucially, LCOE ignores the value of the plant’s output to the grid. For example, solar plants have a much more attractive production profile relative to wind farms because society needs most of the energy during the day when the sun is shining. So, even though the LCOE of solar power is higher than wind energy, it provides electricity that is more economically valuable. A paper found that ‘An LCOE comparison ignores the temporal heterogeneity of electricity and in particular the variability of VRE [Variable Renewable Energy]’. Therefore, the true economics of power generation can be very different to the ones predicted by the LCOE numbers.
Another issue LCOE ignores relates to different lifespans of technologies. Typically, a 20- or 30-year recovery period is accounted for, but what about when competing technologies last half a century or more? Then the comparison is faulty, as nuclear power plants can generate power for 60 to 80 years, sometimes longer.
Other factors that aren’t considered by the LCOE include:
Cost of the land required
Cost to the consumer
Dispatchability, i.e. the ability of a generating system to come online, go offline, or ramp up or down, quickly as demand swings
Indirect costs of generation, which can include environmental externalities or grid upgrade requirements
Additional cost of integrating non-dispatchable energy sources into the grid
Cost of disposal, which is usually built into the price of nuclear energy but excluded from the price of solar and wind power
Subsidies and externality costs, such as the costs of carbon emissions
The cost of backup or baseload power
Intermittent power sources like wind and solar usually incur extra costs associated with needing to have storage or backup generation available. LCOE ignores the cost of this unreliability, which can be as simple as keeping coal-fired power stations running in case they are needed to fire up and meet electricity demand when it becomes less windy or sunny.
Put simply, decarbonising the grid still requires meeting demand at all times. So when there is little sunlight and wind available, energy generation isn’t sufficient, even if it is cheap. To avoid blackouts or electricity rationing, a backup energy supply is needed, and this always comes from dispatchable energy sources, either from fossil fuels or nuclear energy.
Baseload capacity, which has to be ready to deploy when needed, then fills the energy gap, but it is expensive to keep this in reserve. As Oxford University energy economist Dieter Helm puts it, "The more renewables are added to the grid, the more backup must be built as well, even if much of it sits idle much of the time."
An in-depth study of the levelised cost of wind power argues for assessing ‘opportunity cost’ in place of levelised cost. Opportunity cost is defined as “the added cost of using resources (as for production or speculative investment) that is the difference between the actual value resulting from such use and that of an alternative (such as another use of the same resources or an investment of equal risk but greater return)”. The paper found that “wind farms are not cost-effective when a certain output must be guaranteed as major opportunity costs are introduced.”
What the duck does it all mean?
Capacity factor relates to how much resource is available to begin with. No technological advances can change the natural availability of wind, solar, or river flows and therefore influence the natural capacity factor for a given installation. Technology can and does improve how much usable electricity can be obtained, which is called conversion efficiency, but only to a degree.
The capacity factor of solar where I live, in the UK, is around 10%. Worldwide average solar natural capacity factor is between 11% and 13%. California, Australia, South Africa, and the Sahara can attain higher amounts - above 25% capacity factor - but for the rest of the world this is not achievable.
This means that although large installed capacity numbers are implemented, they are still limited, and solar power is only integrated by including (traditionally) fossil fuel backup. Offshore wind in the UK fares better, at around 40% capacity factor, but it still supplies less energy than its fossil fuel baseload partner.
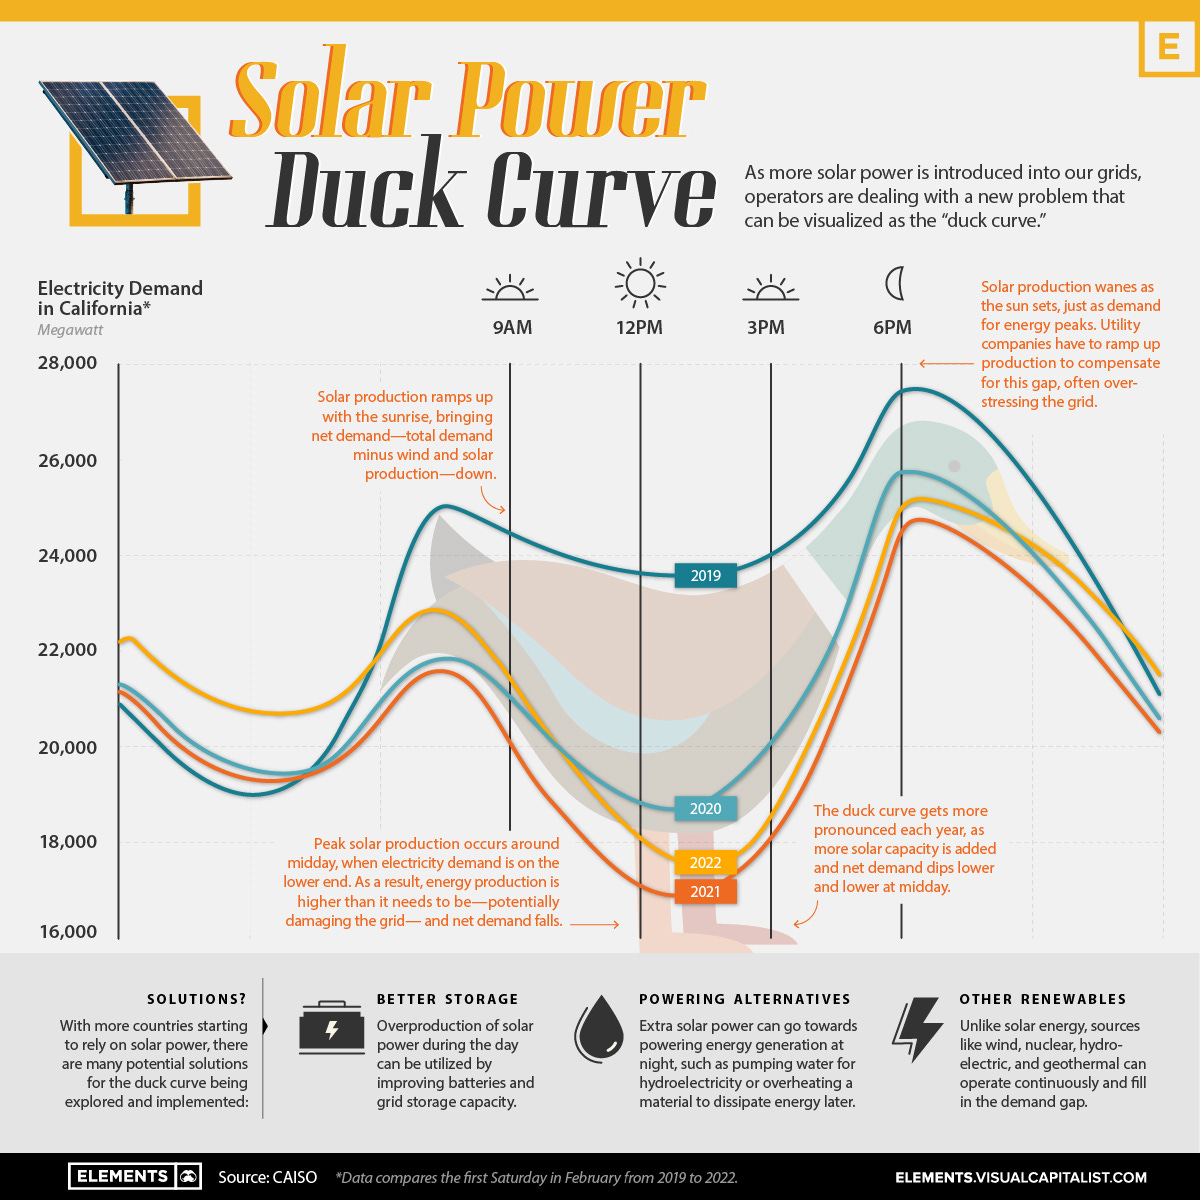
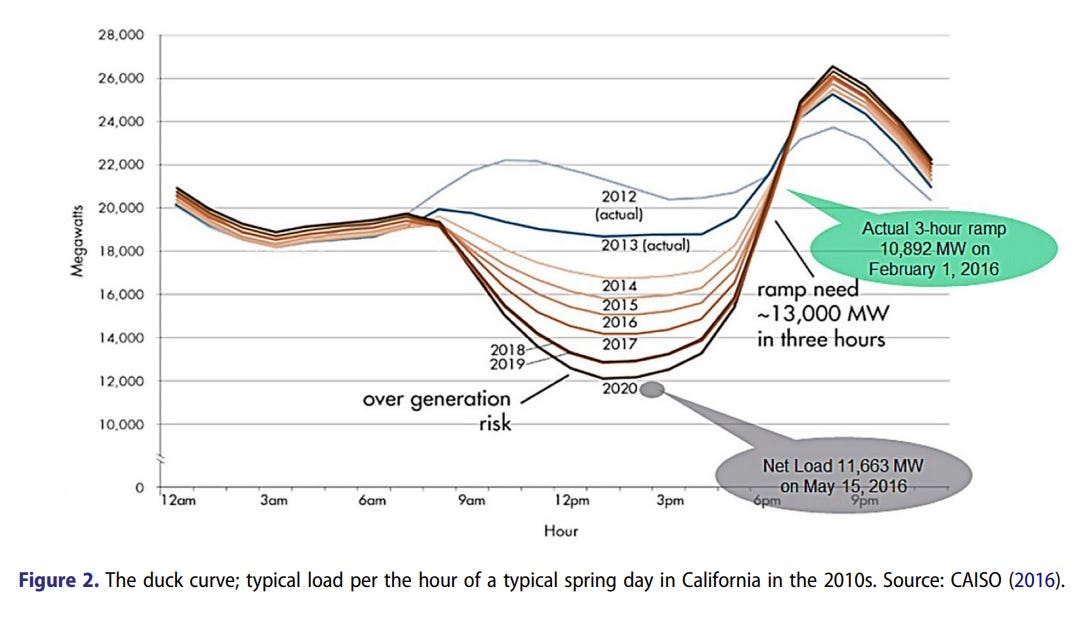
The Duck Curve refers to a graphical representation of electricity demand from the grid on days when solar energy production is high and demand in the grid is low. When plotted on a graph the lines and curves form a duck-like shape, hence the name.
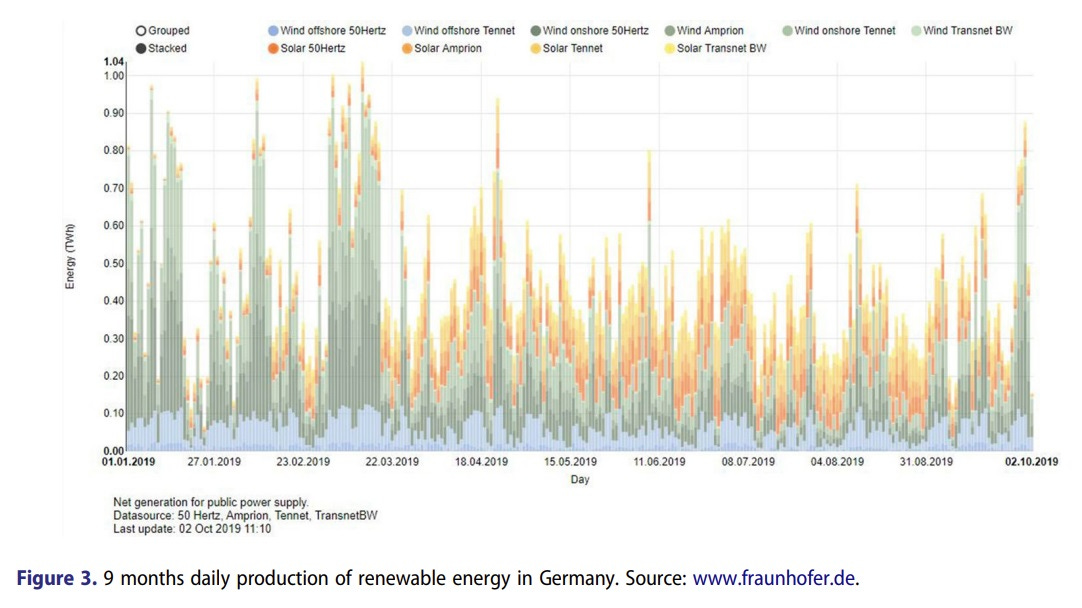
The Duck Curve appears when a significant amount of non-dispatchable energy resources are added to the grid. An example of this is the volatility in the German energy market.
The daily fluctuations are enormous, therefore dispatchable power needs to be ready to step in when wind and solar generation drops.
In Germany, these fluctuations are currently managed by both fossil fuel backup and trade, but the question is what would happen if all of Europe relied on wind energy. Only 13.6% of electricity is traded among countries in Europe. Increasing this would require large investments in transmission capacity in order to trade intermittent energy.
In this figure showing the Duck Curve created by solar power entering the grid on a typical spring day in California, two major deviations from the average have been highlighted to illustrate the amount of variation. The cost of managing this duck curve is substantial.
Various ideas involving a combination of storage, trans-continental interconnections, and demand management are proposed to address the problem of variability. Adding grid development and storage brings up the cost of wind and solar dramatically. This explains why the energy situation in Germany is such a dead duck at the moment.
What should we assess?
Offshore wind connection requires vast amounts of infrastructure, or - to put it simply - ‘poles and wires’. In France, the initial outlay to build an offshore wind site is around €7 billion. However, the total cost of building offshore wind over fifteen years in France is an estimated €32 billion to develop 10-15 GW of power.
Now we are discussing cost more accurately.
When I looked for figures detailing the cost of nuclear reactors against their electricity generation, the internet failed me. You might think that this is surely the clearest measure for assessing outcomes in terms of energy generation. However, finding accurate numbers and converting them to today’s rates becomes complicated.
We do know that the Pressurised Water Reactor (PWR) built en masse in France in the 1970s has the capacity to generate electrical power of 1,650 MW (net) for over 60 years. France's initial nuclear power program cost 400 billion French francs in 1993 currency (around €60 billion), to build 58 PWRs. This culminated in a total gross installed capacity of 66 GWe, producing 400 TWh/yr of electricity, or close to 80% of France’s electricity production.
Now, the French government is keen to fund six new nuclear reactors, with a cost estimate of €51 billion ($54 billion). I read over thirty articles about this supposedly high cost without finding what I was looking for: how much power each of these reactors will add to the grid. Journalists don’t seem keen to, or think to, assess this large upfront cost in terms of actual returns. No doubt France thinks of it as an investment, since the country is the world's largest net exporter of electricity due to its very low cost of generation, and therefore gains over €3 billion per year from this, as well as cheap energy at home.
If one nuclear power plant provides around one GW of power on average, what does that look like in terms of other energy?
Remember, nuclear power plants provide reliable baseload power that doesn’t vary greatly or require backup, additional transmission lines or grid connection, heavy energy trading, et cetera.
It ruffles feathers to say it, but when the cost of unreliability is considered, solar and wind no longer come out on top as being the cheapest.
The price we pay: when ideology trumps maths
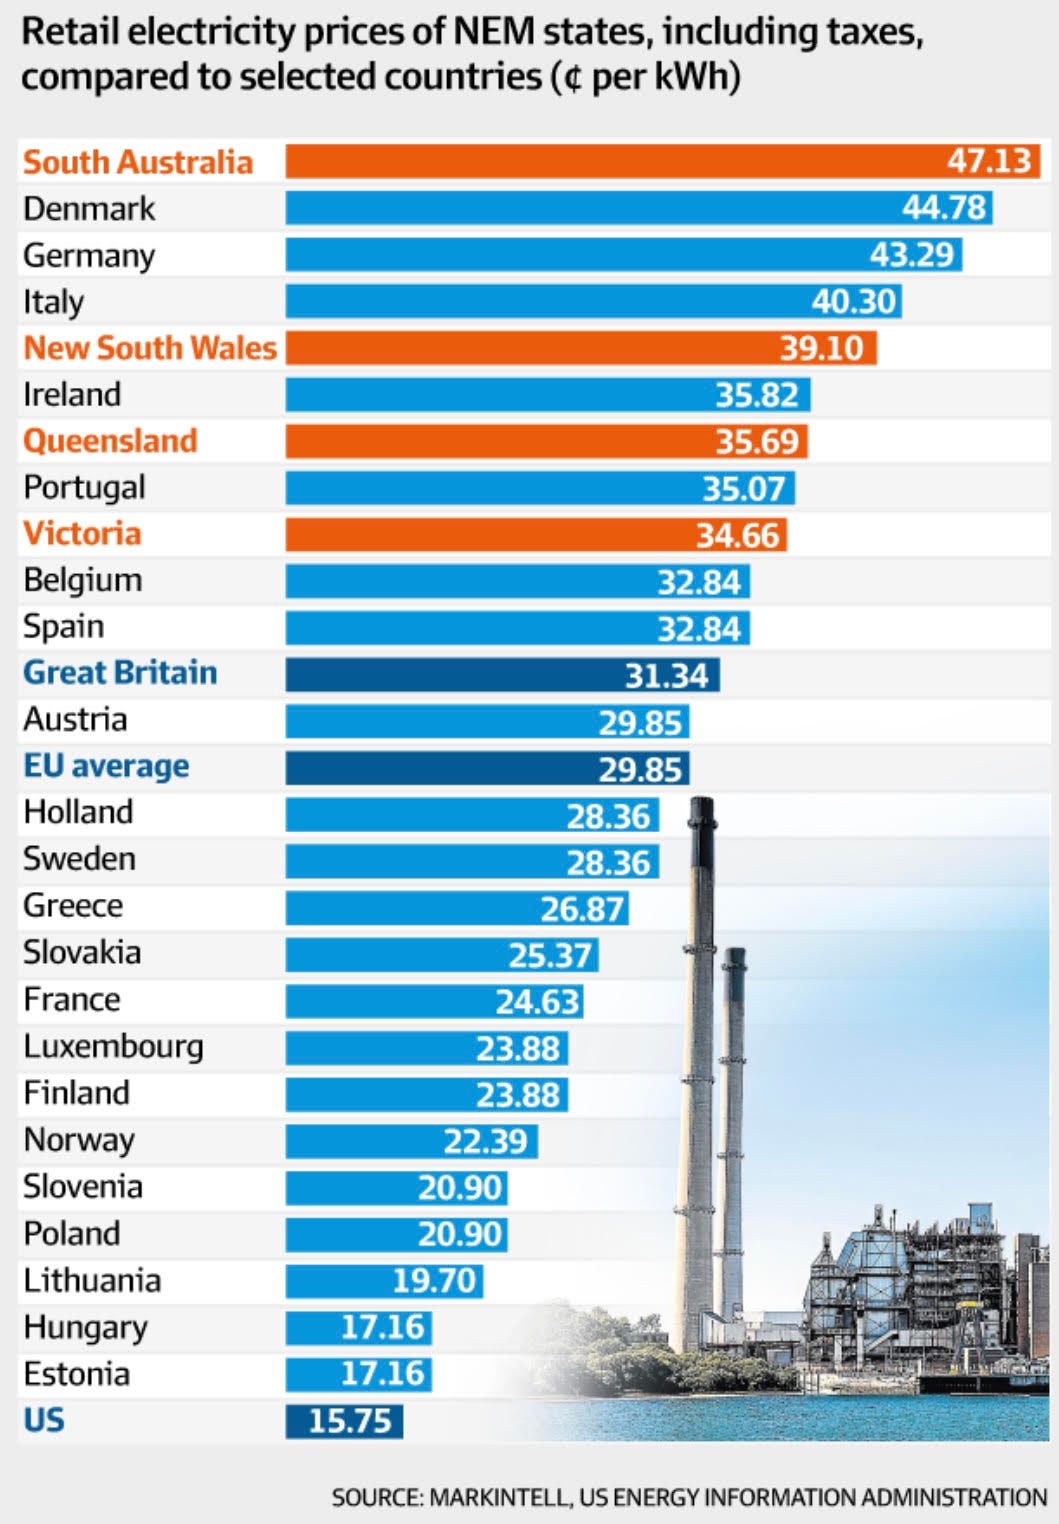
Electricity in California is around double the cost of the average of states in the rest of the US. Electricity in Germany has been much higher than the EU average for years. South Australia's electricity costs are almost double the average of Victoria and higher than New South Wales and Queensland.
What do they have in common?
Case study: California
California has one of the country’s most aggressive plans to transition away from fossil fuels, aiming to attain 60% ‘renewable’ energy by 2030. This will require scaling up wind and solar power significantly and building transmission at unprecedented rates over many years. Maintaining reliability will be a challenge, and will require building large batteries for addressing daily variation and reliable alternative capacity for when wind and sun output are low.
According to the most recent data from the US Energy Information Administration (EIA), California has one of the country’s highest retail electricity prices. In 2020 electricity in California cost 18 cents/kWh, which was 70% higher than the US average. From 2016 to 2020 the price of electricity in California increased by 18%, which was the largest increase in the country.
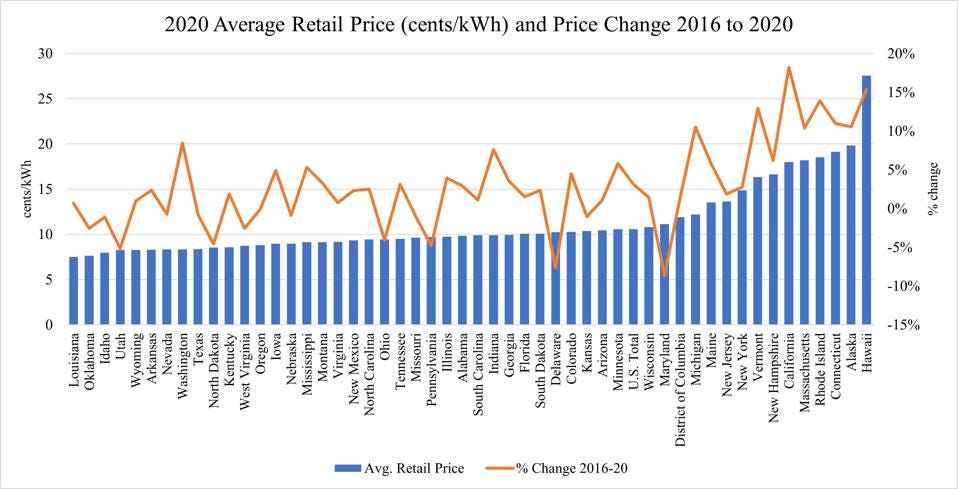
UC Berkeley researchers looked into the reason for high electricity bills in California and found that most of what people pay in those bills is not just the cost of electricity. A higher proportion of the bill pays for climate change mitigation and subsidies for rooftop solar. This cost is shifted onto low-income customers.
Another study by the California Public Utilities Commission found that because lower-income residents use only a little less electricity than higher-income households, they end up with a disproportionate share of the burden when it comes to paying the bills. The bills of older, wealthier Californians decrease as they adopt cost-efficient alternatives, such as buying electric vehicles and rooftop solar panels, while costs continue to rise for low- and middle-income renters who have to use regular electricity as their main energy source.
This is known as ‘shift loading’: the wealthy take advantage of structural billing benefits, which results in a cost shift onto lower-income and otherwise vulnerable customers.
Due to public resistance, California may have changed its mind about nuclear power. California Governor Gavin Newsom has now said that he supports keeping the Diablo Canyon nuclear plant open beyond its planned 2025 closure to ensure the reliability of the state’s electric grid. Research has found that keeping the plant open for another ten years could limit carbon emissions and save the state $2.6 billion in power costs. It’s a start, but doesn’t fully address the problem of shift loading energy costs onto the state’s poorest people.
Case study: New York
New York's policymakers are aiming to switch electricity generation to wind, solar and hydro facilities, along with battery storage, by 2030.
As a result of this, household and business utility bills are estimated to rise by at least 9.9%, which will again heavily impact New York's lower-income communities.
Indian Point nuclear power plant was situated 25 miles north of New York City and had produced clean electricity for New York City and the lower Hudson Valley since 1962. This single power plant provided around one-quarter of New York City’s power. Each reactor produced nearly 1,000 megawatts of power, enough to power over 500,000 homes.
In 2021, essentially because Governor Andrew Cuomo prefers ‘renewables’, the last of the plant’s reactor turbines was shut down. The plant had provided around 1,000 well-paid jobs and half the town’s tax revenue. Linda Puglisi, the town supervisor in the town of Cortlandt in New York, said the shutdown threatened $32 million in annual contributions from the energy company Entergy, including $24 million that was given to the local school board.
Federal data shows that after one of Indian Point’s two working reactors was permanently shut down in 2020, gas use increased from 36% in 2019 to about 40%. In July, the state’s electricity from gas-fired plants rose to about 35%. On the hottest summer days, when air-conditioning is in high use, gas-burning power plants now need to increase their output by as much as one-third in New York.
As one journalist put it: “The 2021 shutdown of the Indian Point nuclear power plant led to near-total dependence on fossil fuels to produce electricity in New York's energy-hungry downstate region, and surging amounts of heat-trapping carbon dioxide in the air.”
A report by the New York Independent System Operator (NYISO), which runs the state’s electric grid, shows that in 2021, 89% of downstate energy came from natural gas and oil, up from 77% in the previous year when both of Indian Point’s two reactors were still running.
As well, in 2021, the average wholesale price of electricity in New York hit $47.59 per megawatt hour after the last reactor was shut down - nearly double what it was the previous year. NYISO’s independent monitor credited the increase in wholesale electricity prices to the Indian Point shutdown.
While some of the problems illustrated by California and New York related to nuclear power plant closures, poor grid management, and over-ambitious wind and solar targets, what’s most clear is that these costs - of switching the grid to one of wind and solar, of trying to replace other energy sources with them, and of building the grid to support this transition - are not accounted for in LCOE figures. And yet again, they hit the poorest people the hardest, which is a cost that those doing the reckoning rarely seem to take into account.
Case study: Germany
People will tell you that the dire situation in Germany is due to the Russian invasion of Ukraine, but this is not true.
In 2014, many years before the invasion, German energy prices were already 50% higher than the EU average. Germany began phasing out nuclear power plants and coal-fired power stations in 2011 as part of its Energiewende initiative to transition to ‘renewable’-only energy.
This proved to be an expensive disaster.
As far back as January 2007, a Deutsche Bank report warned Germany that closing down its nuclear plants would cause a drastic increase in emissions, higher electricity prices, increased blackouts, and force dependence on gas imports from Russia to make up for the energy gap.
According to a 2018 study by the German government's Expert Commission on the Monitoring Process Energy of the Future, the total cost of Energiewende from 2000 to 2017 amounted to approximately €520 billion. This includes costs for feed-in tariffs for wind and solar energy, grid expansion, research and development, and other measures.
In 2019, Germany's Federal Court of Auditors criticised the €160 billion cost of Energiewende - which was spent over five years - stating that the expenditure was “in extreme disproportion to the results”. This cost continued to rise, and we can add to it the €2 billion that their energy subsidy program is currently costing them.
The index value for industry energy prices ‘drastically worsened’ largely due to an increase in the ‘renewables’ surcharge stemming from the Renewable Energy Sources Act (EEG). While the public originally supported this measure, a backlash occurred when energy prices started to soar. As a result of this, in 2021 Germany decided to cut the power surcharge levied on households to support wind and solar energy by 42.7% to help households cope with high energy prices.
One paper found that the social cost of Germany’s shift from nuclear to coal has been around $12 billion per year. Over 70% of this cost comes from the increased mortality risk associated with exposure to the local air pollution emitted when burning fossil fuels.
In 2021, policy analysts warned Germany of escalating costs, geopolitical instability, and a potential energy crisis. I’m not sure we can measure this in terms of dollars or euros, but I think you get the picture.
As reported in Euractiv: “In most EU Member States, when the levelised costs of renewables (LCOEs) were greater than ‘normal’ wholesale prices (1990 through to September 2021), citizens were called on to fund the difference i.e. the difference was socialised in the interests of decarbonising the power sector…In Germany (and proportionally in other countries) citizens are funding renewable windfall profits to the tune of €10 million to €50 million per day, i.e. around €1 per day per household (in Germany) – far more than the reduction in their EEG charge.”
Poor energy policy in Germany is leading to deindustrialisation and hasn’t brought down the country’s emissions as intended. In 2022 German households faced even higher energy prices, and the government urged rationing to avoid blackouts. If any country provides a strong case study for how not to clean up your energy grid, it’s Germany. Now we can see how the sneaky LCOE metric, when followed blindly, can do more harm than good.
Case study: South Australia
South Australia has some of the highest power prices in the world. As with Germany, this impacts industry: one South Australian plastics factory has had to close after 38 years in operation because electricity prices increased by AU$100,000 in 18 months.
Carbon and Energy Markets director Bruce Mountain found that power in South Australia is three times more expensive than in the US and 50% higher than in the UK. Mountain pointed to a combination of factors, including inadequate policy and the cost of ‘poles and wires’ - i.e. development of the grid to support the wind and solar power that had been added to it.
In 2022, Australian residents were told to brace for large hikes in their power bills after a watchdog looked into the costs of overhauling the grid to deal with the wind and solar energy transition - the network, or poles and wires, costs that typically account for up to half the average electricity bill. According to media outlet ABC, renewable industry partner Matt Rennie said he agreed with the need for increased spending on networks, stating that ‘extreme change’ won’t be cheap.
That change might be worth the cost if it worked, but at present large sums of money are fuelling an experiment where the most significant case study - Germany - shows that it will likely fail. At great cost.
Meanwhile, the Australian government estimates that the cost of the batteries to back up current solar and wind will be AU$2.7 billion. Australia is building eight batteries, which have a capacity of 2GW, meaning that they can store energy for around three hours. They will not replace the lost generation from coal-fired power stations that Australia is closing.
These batteries will last up to 25 years, which also needs to be kept in mind when assessing their cost.
Add to this the cost of infrastructure to connect panels and turbines to the grid, and we get an accurate idea of figures that goes beyond the scope of LCOE. Yet Australia’s Minister for Climate Change and Energy, Chris Bowen, still argues that nuclear power is too expensive to build. Australia has a ban on nuclear energy in place, with politicians there arguing that no one wants to invest in nuclear reactors in Australia because of the cost. This is not true: a report found that investment for the energy infrastructure required - from outside investors rather than working people’s pockets - is available, but investors are deterred by the ban. The report found that industry funding is available to invest in energy infrastructure, but investors are waiting on policy direction from the Federal Government, concluding that “Right now, it seems the only politically acceptable investments appear to be relatively small scale, quickly deployed renewable wind or solar projects.”
The subsidisation of wind and solar power, and the cost of funding them falling on already-struggling communities rather than outside bodies, are factors that are excluded from calculations in the LCOE.
Nuclear energy, which we know works and powers many clean energy grids, should now be starting to look a lot cheaper to you. Because it is.
Let’s look at a positive example of a successful clean energy transition, and see how the costs add up there.
Case study: Japan
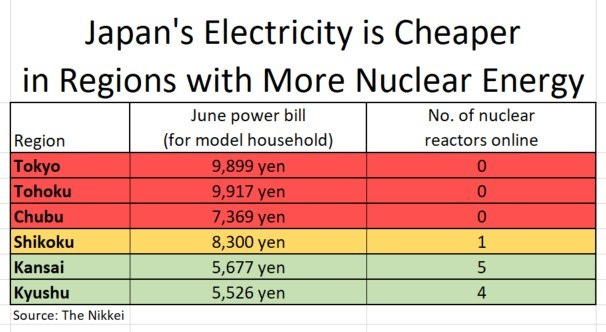
The data is clear: Japan is home to thirty-three nuclear power plants, and Japanese electricity bills are around 40% cheaper in regions where there are more nuclear reactors online.
The Chubu region, which doesn’t have any nuclear reactors, is much cheaper than Tokyo because Chubu can easily import cheaper power from Kansai, which has nuclear reactors.
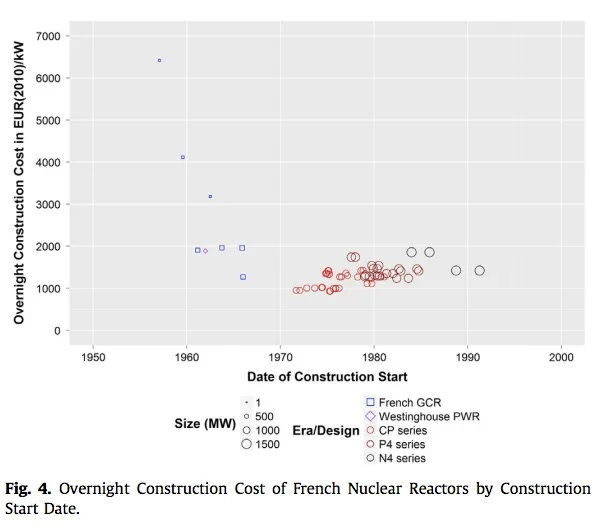
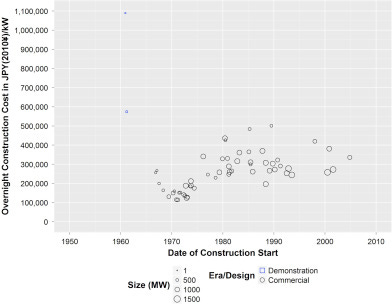
What did Japan do differently? Researchers have written a short history, but in sum, for numerous reasons the cost of building nuclear power plants in Japan did not significantly increase between 1975 and the 2000s, with the unit construction cost staying the same.
What does nuclear energy cost?
As others have noted, it is difficult to know the true cost of nuclear power.
Here’s what we do know.
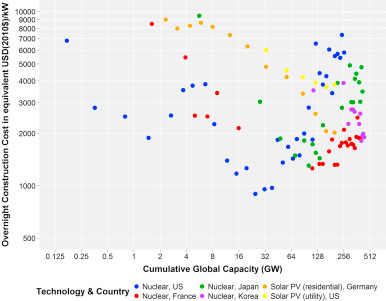
There are two periods in nuclear power construction history where costs declined sharply and at rates that are comparable to solar photovoltaics. These are the early development of nuclear power up to 100GW, and the recent experience of South Korea.
Regarding the first period, researchers found that “Had the early rates continued, nuclear power could now be around 10% of its current cost. The additional nuclear power could have substituted for 69,000–186,000 TWh of coal and gas generation, thereby avoiding up to 9.5 million deaths and 174 Gt CO2 emissions. In 2015 alone, nuclear power could have replaced up to 100% of coal-generated and 76% of gas-generated electricity, thereby avoiding up to 540,000 deaths and 11 Gt CO2. Rapid progress was achieved in the past and could be again, with appropriate policies.”
South Korea is our second example. In the mid-1980s the Korean nuclear industry decided to standardise the design of nuclear plants and to gain independence in building them. The country imported proven US, French, and Canadian reactor designs in the 1970s and learned from other countries' experiences before developing its own domestic reactors in 1989. It developed stable regulations, had a single utility overseeing construction, and built reactors in pairs at single sites.
The results were remarkable: between 1971 and 2008, South Korea built a total of 28 reactors. Due to the developments they made in 1989, their overnight construction cost fell by 50%.
According to the Energy Policy paper, the decline in South Korean nuclear power costs is comparable to the decline in solar power costs in Germany over the same time period. (Though solar kept getting cheaper past 2008.)
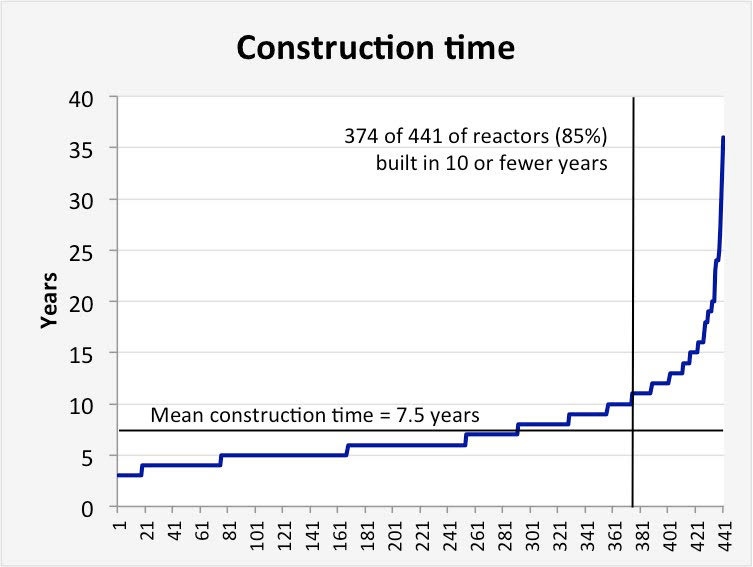
Standarisation has also been found to lower the costs of building nuclear power plants in France and the US. A study of the French nuclear scale-up in the 1970s found that: “Key to this success was a unique institutional framework that allowed for centralized decision making, a high degree of standardization, and regulatory stability, epitomized by comparatively short reactor construction times.” Later, social pressures for improved safety forced design changes over the years, and this resulted in higher costs.
Uncertainty about the cost of construction is overwhelmingly important in determining the cost of electricity from nuclear because building the plant accounts for nearly 80% of the total price tag.
Don’t forget system costs
With nuclear energy, waste disposal and decommissioning costs are usually fully included in the operating costs, but they are not accounted for in wind and solar costs. Yes, a single solar panel is cheap. But what about disposing of it? Sadly, they often end up in landfill sites in poor countries abroad, where they leach toxic chemicals. Batteries are currently not recycled, and therefore this is another missing cost. Wind turbine blades face similar issues. And none of these elements will last more than thirty years before they need replacing. What will that cost?
A 2019 report titled The Costs of Decarbonisation: System Costs with High Shares of Nuclear and Renewables probes the system cost question more fully. It shows how the variability of wind and solar PV production imposes costly adjustments on the residual system, and that these system costs are currently not properly recognised in any electricity market. They are simply borne by the system in a way that makes it impossible to create a sensible energy transition policy.
According to the report, "The most important categories of system costs of VREs are increased outlays for distribution and transmission due to their small unit size and distance from load centres, balancing costs to prepare for unpredictable changes in wind speed and solar radiation and, perhaps most importantly, technologies and costs for organising reliable supplies through the residual system during the hours when wind and sun are not fully available or not available at all."
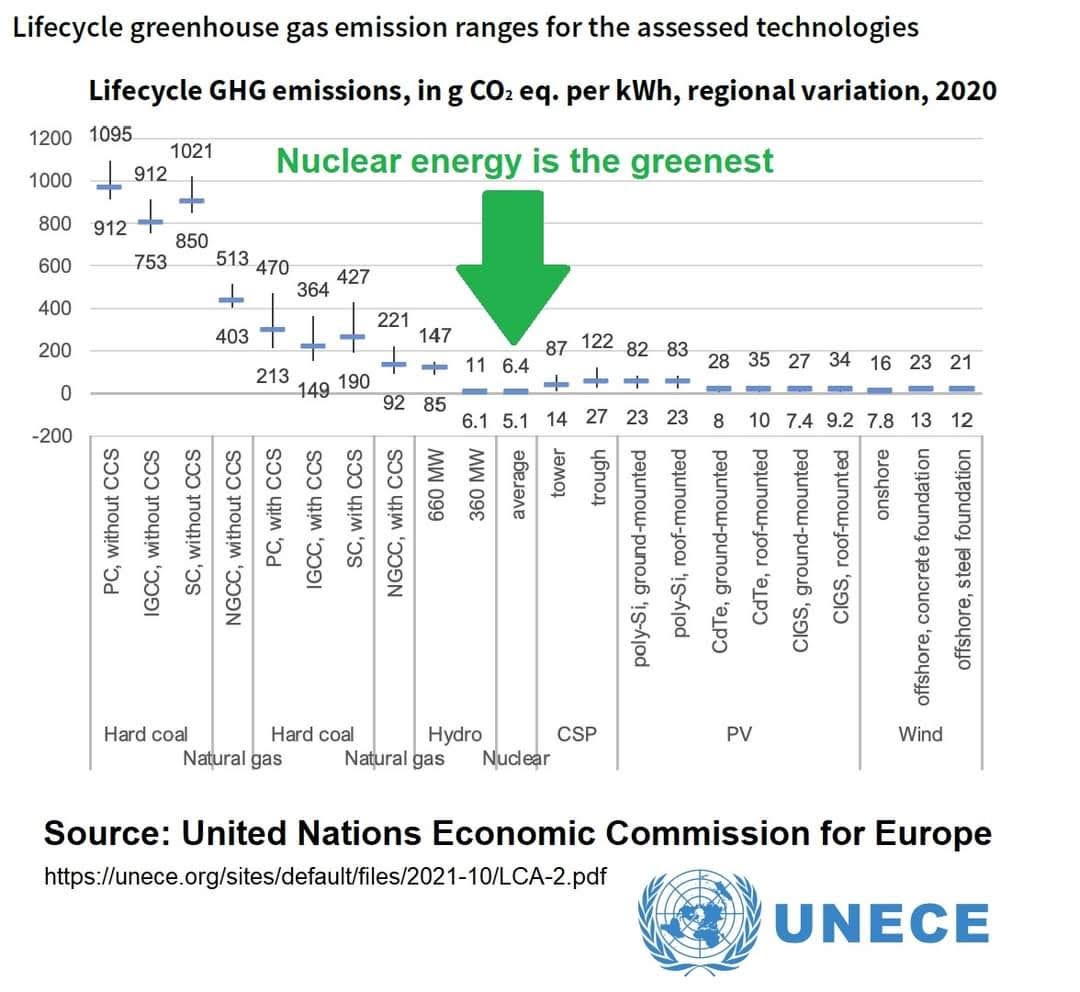
If we want to complicate things even further, consider the raw materials used to construct these different types of energy generation.
The clear winner according to UNECE? Nuclear energy. Fewer resources mean lower financial costs, and also less cost to the environment.
The cost of losing and excluding nuclear
I’ve already covered the outcomes of nuclear power plant closures in Germany, California and New York, but here’s a reminder. Research into the consequences of Germany closing its nuclear power plants found that: “Valuing carbon emissions at a social cost of carbon of $50/tCO2, the phase-out results in estimated climate change damages of $1.8 billion.”
While solar and wind power have become cheaper over time, nuclear energy has not become cheaper in most parts of the world, simply because it is excluded from subsidies and other initiatives. Thanks to the misinformation around the cost of nuclear energy, many climate-focused policies exclude nuclear outright, for example the Sustainable Development Goal for affordable and clean energy, SDG 7, excludes nuclear power on the basis of ‘affordability’. Therefore, nuclear cannot compete equally with other types of clean energy.
Oil and gas companies celebrate wind and solar power because they keep fossil fuels in business. Today, wind and solar are backed 1:1 by oil-and-gas-based generators, to fill the gaps when it isn’t windy or sunny, thus keeping the oil and gas industries in demand. In the future, solar purists propose mega storage, which means more batteries, and overbuilding (extra panels) as the solution. These extra costs aren't factored into LCOE.
The true cost of not building and retaining nuclear energy? More fossil fuels.
Climate justice for who?
The same people who advocate for ‘renewables’-only energy grids also call for ‘climate justice’. But surely taking into account the impact on people also means caring about the cost to communities. As we’ve seen with the examined case studies, even though different countries are approaching their clean energy transitions differently, they have the same outcomes in terms of increased greenhouse gas emissions, air pollution, and higher electricity bills for lower-income working people.
All people need access to clean and reliable energy. If wealthy nations can’t pull off this transition to only ’renewables’, what hope is there for poorer countries? Currently, 940 million (13% of the world) lack access to electricity, and if they are going to be denied the financially-cheap but environmentally-costly reliable fossil fuels that they need to develop, then they need to be offered equally cheap clean energy instead, which requires an honest discussion about what the total costs of them are.
We can build wind and solar power, but the myth that they are cheaper than the alternatives needs to be busted. They’re not cheap for many reasons, but especially not for consumers, aka ordinary working people, and misleading people about their true cost is wrong.
Moving beyond LCOE
I considered writing this article using actual measures of energy produced alongside the cost of each reactor or wind farm or solar farm and comparing them. But as I said earlier, it would still be like comparing apples and oranges. Or, to be more accurate, comparing a bushel of apples with a single grape.
In many cases, we do not know the full costs of the many variables discussed in this article. We do know that, regarding upfront costs, research has found that “trends in costs [for nuclear reactors] have varied significantly in magnitude and in structure by era, country, and experience” and, more importantly, that “there is no inherent cost escalation trend associated with nuclear technology”.
As well, there is the risk of simply throwing around large numbers for the sake of it. To be accurate about costs, we’d have to adjust for inflation to truly convey the cost of nuclear power plants that were built decades ago, convert Japanese Yen and French Francs into meaningful sums today, adjust for different reactor sizes, and so on. There are simply too many different approaches to energy transitions. By adding imaginary numbers, it would be impossible to make the arguments accurately. We have to look at the data available, which I have outlined in this article, and think about it in a holistically.
Overly confident but energy-illiterate journalists regularly report from a one-on-one comparison basis, arguing that, for example, “Advanced nuclear reactors are estimated to cost $5,366 for every kilowatt of capacity. That means a large 1-gigawatt reactor would cost around $5.4 billion to build, excluding financing costs. By contrast, a new wind farm costs just $1,980 per kilowatt.”
We now know that this simply isn’t true.
Do these figures include just the turbines, or the poles and wires that are needed for transmission as well? Do they include baseload and the cost of keeping power plants running when capacity factor is low? Do they include subsidies? The cost to ordinary people who have to fund the transition? And so on. Such is the problem with crunching numbers using the misleading LCOE metric, and the way it forms the basis of our misunderstanding about what energy truly costs.
What I have tried to do here is trigger a thought experiment by illustrating how complicated these assessments are, that it is not a case of comparing one panel to one plant, and that the LCOE fails on all counts. Ultimately, the full cost of nuclear energy is an upfront investment for a long-lasting, reliable form of energy, which is not the cost people consider when arguing that solar panels and wind turbines are cheaper. Nuclear energy can get cheaper, or it can get more expensive, depending on how it is approached.
To make the correct policy decisions and effectively decarbonise the grid, while also keeping it running smoothly, we need to build a model of the grid that includes many factors including the uncertainties in supply and demand, estimates their impacts on prices and investments over decades, including installation costs, operations and maintenance costs, life-span estimates, inflation estimates, and the capacity model just discussed.
Such modelling would be a major undertaking far outside the scope of this article, and as far as I know it has not been undertaken by anybody yet. It would, however, be game-changing for informing energy policy, should world leaders choose to use it.
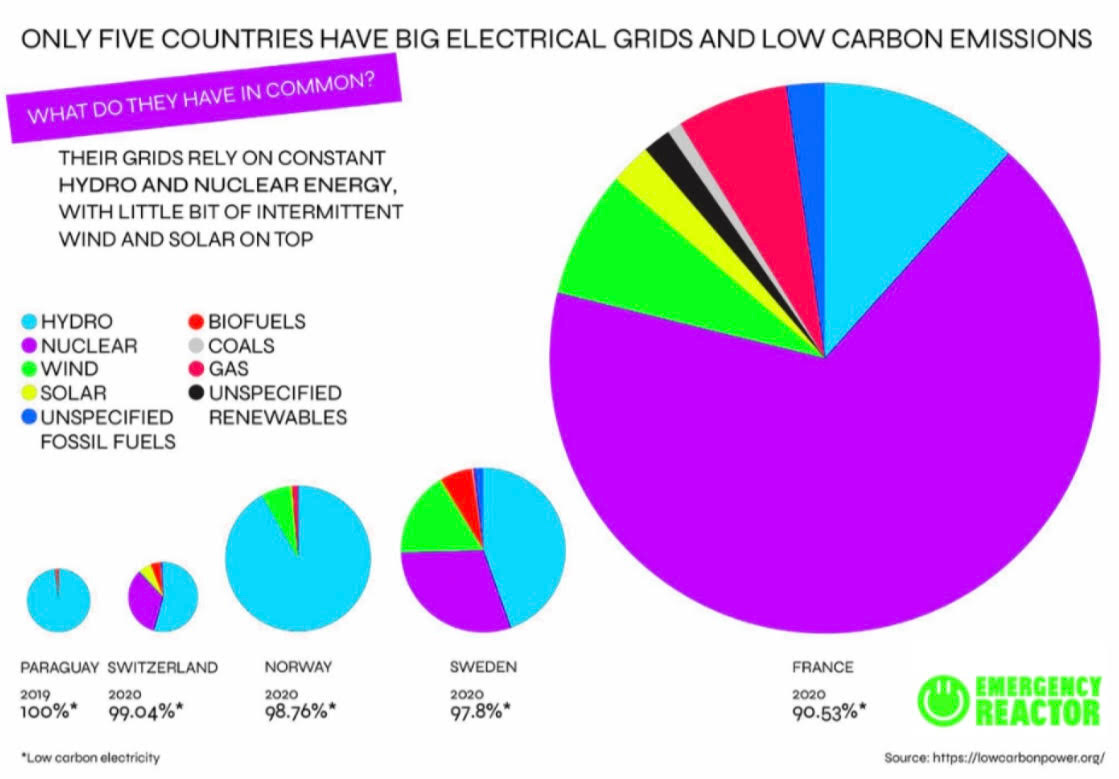
It is incredible to think that politicians around the world are making decisions on how to implement and fund the clean energy transition without having such accurate modelling to form the basis of their decision-making. Without it, they simply cannot make informed and effective decisions that will benefit people and the planet. The closest case studies we have are France, Sweden and other countries that have already decarbonised and can therefore provide a simple map of the direction we need to head in.
This article has focused mostly on wind and solar power, as they are heavily touted as being cheap forms of energy. It’s also worth noting that often when people pit nuclear against wind and solar they lump the latter in with ‘renewables’, but not all so-called ‘renewables’ are created equally and this should also be factored into costings.
I am of the opinion that we should build everything we need to bring down greenhouse gas emissions and reduce deaths from air pollution. Yet it is clean energy advocates who only like wind and solar power who argue against nuclear energy based on the myth that the latter is too expensive.
In reality, the ultimate cost to us all is that of not tackling climate change, which will be substantial and far greater than the numbers discussed here.
Every time a nuclear power plant is replaced with fossil fuel generation, people die from the resulting air pollution, and more fossil fuel waste is stored in the Earth’s atmosphere. Every time a grid is made to support more wind and solar power without the baseload power to support them, fossil fuels win as they have to fill the gap. Every time a nuclear power plant isn’t built on the supposed basis of cost, the environment is further harmed and human progress takes a step backwards. Every time someone quotes the LCOE, they are either being misled, misleading others, or both.
Instead of arguing that some clean energy is more expensive than others, we should consider the following question instead:
Can we afford to get this wrong?





Another great article, informative, myth busting and thought provoking.
Great piece! I've often had a hard time wrapping my head around some of the factors that mislead people in saying that "nuclear is too expensive" and this does a great job of looking at it holistically! Great one