


Move over, LCOE. LFSCOE is the new metric in town
Two revealing analyses calculate the true cost of electricity


How do we know what electricity costs to produce? Governments, investors, and plant owners rely on the Levelised Cost of Electricity (LCOE), which combines fixed and variable costs into a single figure. However, LCOE fails to account for issues like intermittency and non-dispatchability, which are crucial since the variability of power generation plays a significant role in determining the costs of different energy sources. LCOE also overlooks other costs and expenses, such as ensuring demand is met and maintaining a reliable and usable electricity supply.
I dissected the pitfalls of LCOE in detail in this post:

Study 1: Levelised Full System Costs of Electricity
New research introduces a new metric for assessing cost, called the “Levelised Full System Costs of Electricity” (LFSCOE). It addresses the limitations of LCOE by comparing the cost of meeting the entire market’s needs with a single energy source, plus storage. Similar to LCOE, LFSCOE provides a single cost figure for each technology but offers a more comprehensive and accurate representation of the overall cost.
The LFSCOE is the first cost measure to consolidate the total cost of providing electricity into a single figure for each market and technology. It takes into account the full system cost, including energy storage, overproduction, and the challenges of integration.
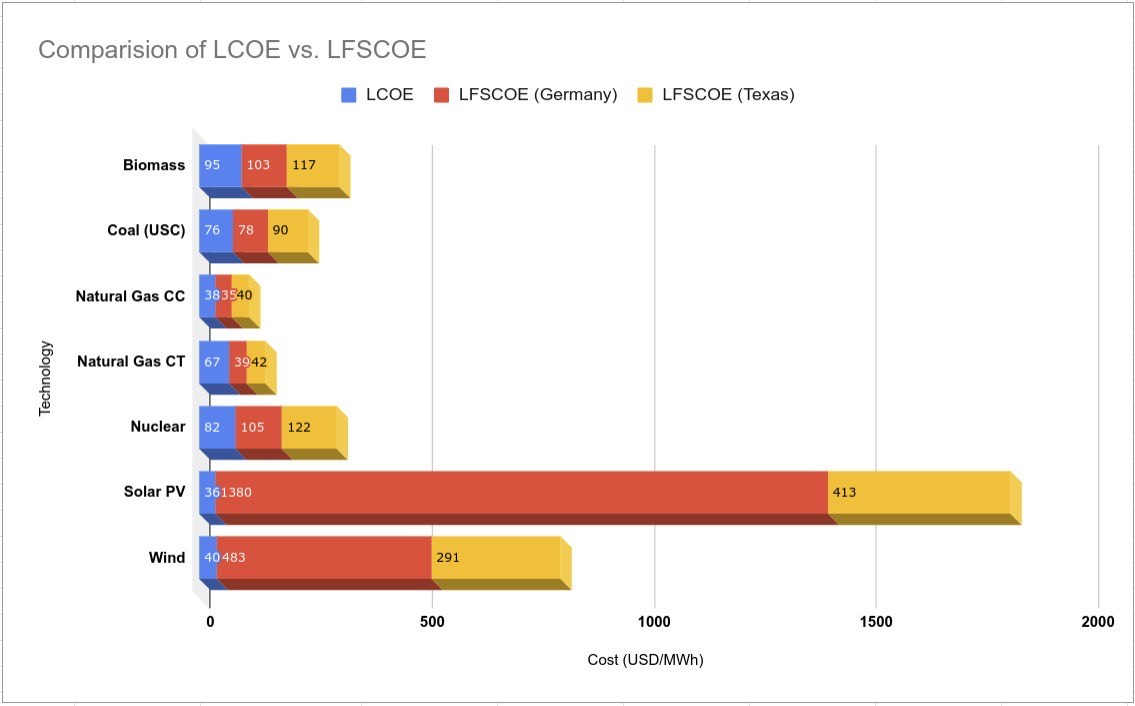
LFSCOE is based on the straightforward assumption that each energy source must meet demand throughout the year, including with the support of storage. Since LFSCOE is significantly higher than the LCOE for wind and solar, it highlights that LCOE fails to accurately capture the costs associated with intermittency.
The paper calculates LFSCOE for different technologies by examining two markets - Germany and Texas, both of which have high amounts of wind and solar power. It also explores refinements, such as the LFSCOE-95 metric, which requires each technology to supply 95% of the total demand.
Contrary to what LCOE tells us, the paper finds that LFSCOE is much higher for wind and solar compared to conventional and dispatchable fuels, due to the significant storage needed to address the intermittency of wind and solar energy. Think of it this way: You need to travel 100 miles. The first 90 miles cost you £10 – that’s LCOE. However, the last 10 miles will cost you another £90 – the total cost is LFSCOE.
The paper shows that as reliance on wind and solar increases, system costs rise exponentially due to overproduction and storage needs. Storage losses have minimal impact on overall costs because renewable overproduction is already high.
Even with a 90% drop in storage costs, renewables still remain uncompetitive based on LFSCOE. By introducing LFSCOE-95, which assumes that up to 5% of the annual demand can be met by a low-cost, dispatchable energy source, researchers found that limiting intermittent renewables to supply only 95% of the demand can reduce system costs by half. You can get a free lift for the 5 of the 10 miles from someone reliable, so the cost for the remaining 5 miles is much lower - whether it's covered by nuclear, fossil fuel, or hydropower.
Currently, no power system relies entirely on wind or solar. As the market share of wind and solar grows, LCOE becomes less accurate because it doesn't account for the additional costs of balancing the grid and handling overproduction. Once their market share reaches 95% (or 100%), the LFSCOE-95 (or LFSCOE) provides a far more accurate measure of their true costs, as it includes these critical factors that LCOE overlooks.
It’s a useful way of measuring cost. LFSCOE-95 can be adjusted to LFSCOE-90 or any other level of demand to calculate more accurate results. By explicitly accounting for the cost of intermittency, it becomes possible to estimate the value of the generated power at different stages of the energy transition and incorporate it into the overall cost measure.
As the graph illustrates, the LFSCOE for wind and solar is significantly higher than that of dispatchable fossil fuel generation in the examples presented. Even with a 90% reduction in storage costs, wind and solar remain uncompetitive when considering the full system cost.
The key takeaways from this data are threefold. First, policymakers should not rely solely on LCOE when planning energy transitions. Second, having backup generation is imperative to keep costs low. Third, LCOE has been biased in presenting nuclear energy as an expensive source of generation, as it fails to factor in the additional metrics that LFSCOE assesses.
Study 2: Building back better: How big are green spending multipliers?
A report by the International Monetary Fund (IMF), Building back better: How big are green spending multipliers? examines the economic impact of green spending, particularly in clean energy and biodiversity conservation. It estimates the output multipliers for green investments and compares them to those for non-eco-friendly expenditures.
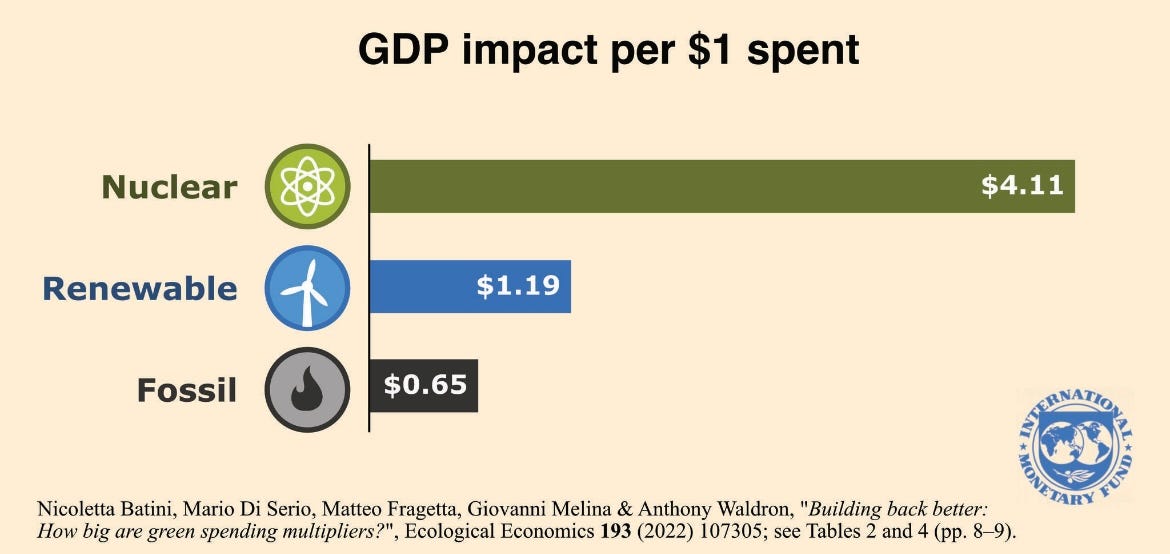
According to this research, nuclear energy provides a strong economic boost, contributing $4.11 to GDP for every dollar invested. In comparison, solar and wind contribute $1.19, while fossil fuels generate only $0.65 per dollar. This means that nuclear energy has an economic impact approximately 3.5 times greater than solar and wind, and about 6.3 times higher than fossil fuels. Although nuclear's multiplier slightly declines over time, it still outweighs the other sources of energy generation.
The paper finds that nuclear has the highest initial multiplier, and nuclear investment stimulates employment and industry. Nuclear energy investments do begin with a higher initial multiplier, which diminishes over time, but it is still significantly higher than the alternatives.
The paper also finds that, compared with renewables, nuclear projects require more highly skilled labour and tend to generate well-paying jobs. Nuclear energy infrastructure boosts local economies with long-term jobs and supply chain demand.
The findings suggest that nuclear energy investments provide a strong economic stimulus, with the caveat that the long-term cost-effectiveness of power plants depends on regulatory stability, financing, and speed of deployment. When politicians approach investment efficiently, nuclear energy offers the highest-impact investment of all energy sources.
The key takeaways from this paper are that:
Green energy and biodiversity conservation create more jobs and economic activity than traditional fossil fuel and industrial agricultural subsidies.
Spending on biodiversity conservation has long-lasting economic benefits.
Policymakers should prioritise green spending to achieve sustainable economic growth.
To summarise both papers, the combination of reliable supply, job creation, long-term operation, and energy security positions nuclear energy as the cheapest, cleanest energy source. It also serves as an unmatched driver of GDP growth when compared to intermittent renewables and fossil fuels. This means that, contrary to the myths based on the outdated LCOE metric, there is a strong environmental, economic, and social case for moving forward with building nuclear power plants.
Must-read breakdown of the right way to measure the cost of renewable energy.
Great writing! People use LCOE as a gospel trying to prove that nuclear is dead and not needed anymore with so much cheaper W&S. Contrary to intuition that something is off, looking at countries with high penetration of W&S and price of power there. Guess it is not necessarily the problem of LCOE itself but abuse of reading to much out of that(with agendas).
The multiplier factor is amazing and we all should spread that knowledge from the rooftops. If only nuclear costs would go back to being clearly cheaper than coal(should be cost and timelines). How much that multiplier would improve with Nuclear at 30-40money units/MWh?